
As Harvard College accepts its most diverse class yet for the second time running, pressure is on for the rest of the university to match the demographics of its students. Harvard’s efforts to diversify the student population, which began relatively recently, have been widely successful. For example, the majority of current students were born before the Harvard-Radcliffe merger, allowing women to obtain Harvard College diplomas for the first time 18 years ago. Meanwhile, the demographic composition of academic staff appears to lag behind that of its students in most counts of diversity. Harvard aims to master all academic and non-academic pursuits, boasting a diverse list of concentrations, graduate schools, and research endeavors. Thus, employing a diverse range of people is essential to promote excellence in a vast array of subjects and initiatives.
Data collection
Publically available data was collected from Harvard’s Office of Institutional Research, which recorded the annual gender and race proportions in five categories of employment between 2003 and 2015. The analysis below primarily focuses on two academic areas of employment: faculty, which encompasses all roles related to teaching, and research, which includes any research or non-faculty appointments such as Postdoctoral Fellows and Research Associates.
The proportion of women in faculty and research is steadily increasing
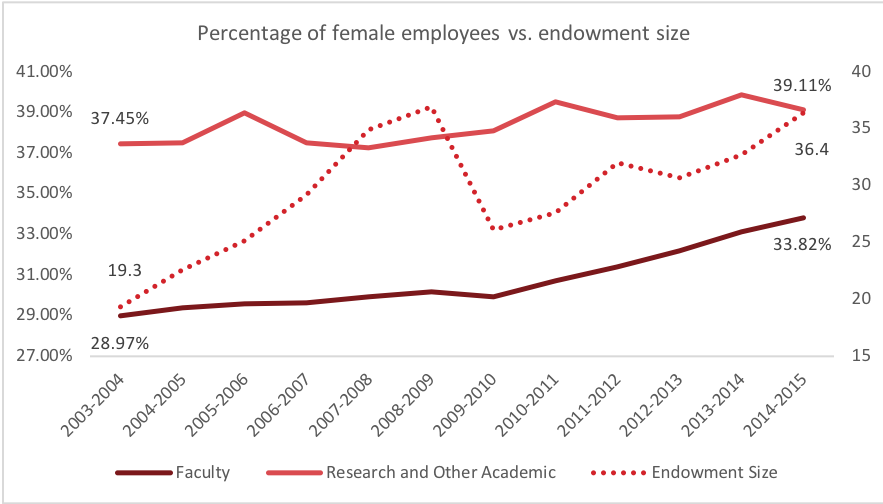
Between 2003 and 2015, there was a substantial increase in the number of women hired for both faculty and research positions, with average annual growth rates of 2.04 percent and 5.24 percent, respectively. Research hires likely grew more quickly than faculty hires due to the relative ease and lower cost of hiring researchers compared to hiring faculty members. However, when examining the proportions of women in each position, the trend is reversed. The proportion of women in faculty has grown from 28.97 percent in 2003 to 33.82 percent in 2015, a change of 4.85 percentage points. Meanwhile, the proportion of women in research has grown from 37.45 percent to 39.11 percent, a change of only 1.66 percentage points. The growth of the proportion of women in the faculty has also been considerably more consistent.

The growth of women as a proportion of faculty was considerably lower in the years between 2008 and 2010, which may be due to the financial crisis and reduced endowment returns. But a similar drop was not found in the proportion of women in research. Part of the reason could be that there are more institutional barriers to hiring new faculty and cutting established faculty. Since women constituted a large proportion of new hires in the years preceding the financial crisis, they were also likely to constitute a higher proportion of the non-tenure faculty and could have been cut in higher proportions during years of financial strain.
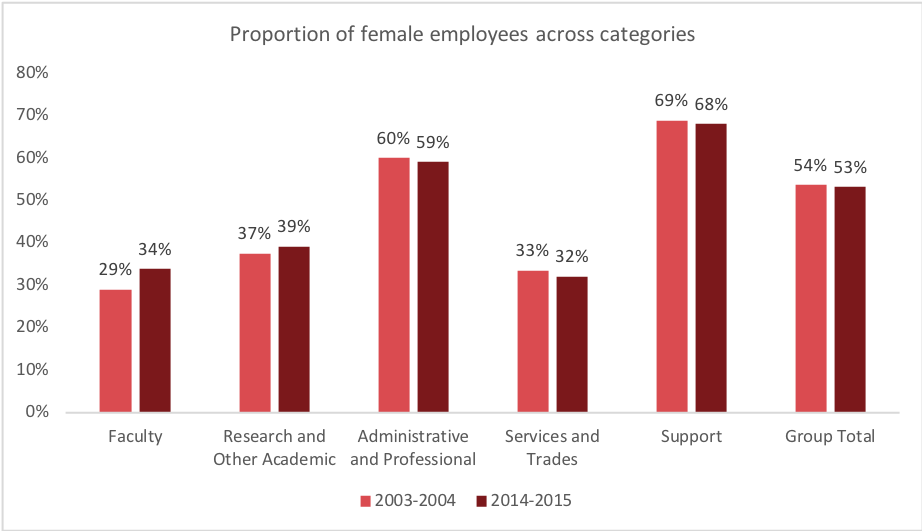
Moreover, while the proportion of women in faculty and research positions has increased over this period, although in different degrees, the proportion of women in other employment areas has actually decreased. In general, this represents a shift towards greater gender balance across Harvard’s staff, with more women being hired where they are traditionally underrepresented and fewer women being hired in areas where they have been overrepresented.
Overall, these trends indicate a cause for optimism: significant progress is being made toward gender balance in all areas of Harvard employment. However, Harvard can still do more to improve its gender diversity. Nationally, women constitute 44 percent of faculty at postsecondary institutions and just over half the total population, but only 33.8 percent of faculty at Harvard in the latest year with data. While the proportion of women in faculty and research positions at Harvard has shown encouraging growth from 2003 to 2015, gender diversity at Harvard still lags substantially behind national rates.
Some minorities are still underrepresented or entirely absent
In terms of ethnic minorities, the number of American Indians and Alaska Natives in the faculty generally increased until the academic year 2008-2009, peaking at six people. Since then, however, this number has been on the decline, dropping to zero faculty members in 2014-2015. Furthermore, in the 12 years covered by obtained data, there were no Native Hawaiian/Pacific Islanders in the faculty.
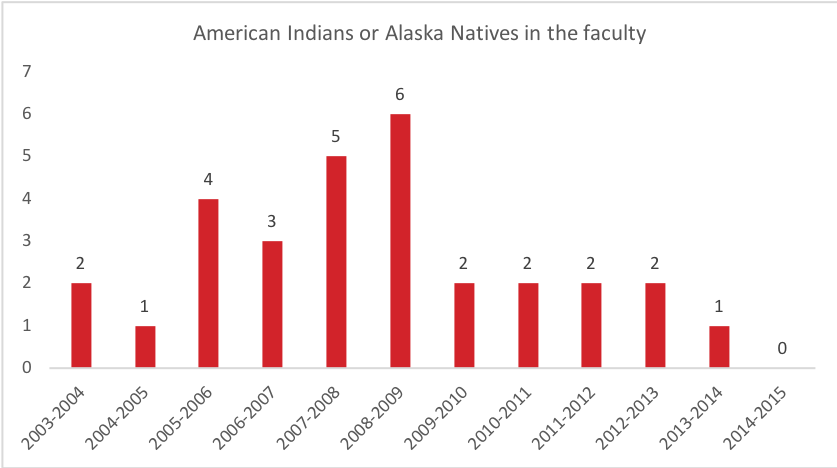
American Indians/Alaska Natives and Native Hawaiian/Pacific Islanders were the only ethnic minority groups that did not seen an increase in representation over the period examined. Nonetheless, there is reason for optimism. The hiring of Harvard’s first Professor of Native American Studies this year could signal a first step in upcoming efforts to diversify the academic curriculum and its faculty.
Percentage of Black or African American and Hispanic faculty increasing, but lagging behind national average
The percentage of faculty who are either Black or Hispanic has been increasing at a slow but steady rate. Black and Hispanic proportions of faculty grew from 2.58 percent and 2.37 percent in the 2003-2004 academic year to 3.52 percent and 3.27 percent in the 2014-2015 academic year, respectively. The proportion of Asian faculty has been increasing an even higher rate: in the academic year of 2013-2014, the percentage finally broke into double digits, reaching 10.3 percent.

Despite the increase in the proportion of faculty who are Black at Harvard, this proportion is still far below the national average at postsecondary institutions. Nationally, African Americans make up approximately 6 percent of university faculty; relative to their proportion of the general population — 13.3 percent — African Americans are vastly underrepresented in university faculty nationally. Yet the proportion of Black or African American faculty at Harvard is four times smaller than that number.
The proportion of white faculty is decreasing, but still significantly larger than the general population
In contrast, the percentage of white faculty at Harvard has been in decline in the 12 years of available data, dropping from 77.89 percent to 73.98 percent. This decrease has brought the proportion of white faculty at Harvard below the national average of 77 percent in higher education. Regardless, this proportion still indicates that white professors are overrepresented in faculties at Harvard and nationally;according to census data, white people constitute just 61.3 percent of the U.S. population.

Harvard is making improvements, but could do more
This analysis has highlighted consistent increases in faculty diversity in certain areas of academic employment. The proportion of women in research has soared in recent years, and the percentage of Black, Hispanic, and Asian faculty members has been increasing at a steady rate as well. However, other minorities such as Native Americans/Alaska Natives and Native Hawaiians/Pacific Islanders have not seen the same increase; instead, there has been a decrease in representation among these minority groups. Furthermore, the increase in race and gender diversity at Harvard still lags behind the national averages for faculty and far behind population proportions. Moving forward, Harvard should focus on hiring employees from minority groups that have seen a decrease in representation between 2003 and 2015, and raise the proportion of all underrepresented faculty members at least to the national average, striving toward achieving national population proportions in the long-run.
This article is the product of analysis by the Harvard Open Data Project, a student-faculty group that analyzes public Harvard data to hold Harvard institutions accountable. The raw data can be found here.
Olivia Bryant, Lucy Li, Kevin Bi, and Neel Mehta contributed to this article.
Image Credits: Wikimedia Commons/ Caroline Culler.