
This article was co-written by Miroslav Bergam, Lucy Ding, Erin Guetzloe, Kodi Obika, Dominic Skinnion, Yao Yu, and Amy Zhou.
Introduction
With election night quickly approaching and the threat of COVID-19 presenting a compelling case for facilitating mail-in voting and allowing for delayed results, many are looking to polling data and election forecasts as a means of gaining some clarity regarding such an unprecedented election year. Many others, still jaded from the 2016 election, refuse to take forecasts seriously again. We are of the view that election forecasting, despite being an imperfect science, can ultimately still provide valuable insights and information in the 2020 election. That being said, we have decided to formulate our own election prediction model as a means of not only quantitatively determining and documenting the political landscape at this moment in time but also seeing to what extent our predictions ring true. We would especially like to thank Professor Ryan D. Enos, Soubhik Barari and Sun Young Park of the Harvard Government Department for their insights and teaching of GOV 1347: Election Analytics.
Two-Party Popular Vote Prediction
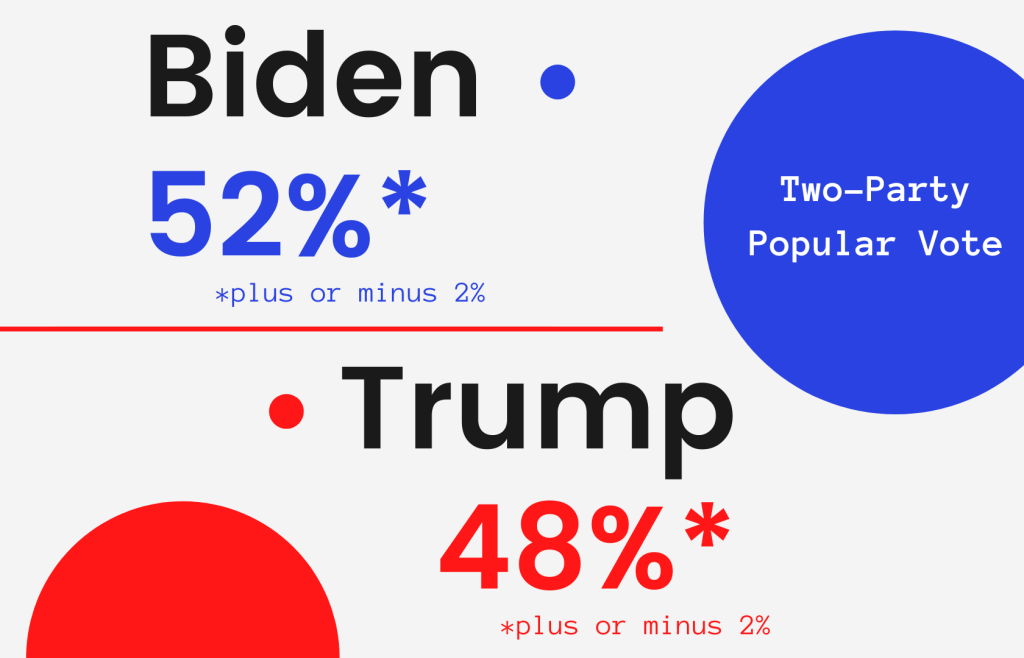
Our two-party popular vote prediction has Joe Biden winning 52% and Donald Trump winning 48%, both with margin-of-errors at plus or minus 2%. This prediction is only looking at the two-party popular vote, meaning that it doesn’t take into account third-party candidate votes, only votes for the candidates of the two major political parties, Joe Biden and Donald Trump. The model that created this prediction uses data from past elections such as national polling averages of popular support among former Democratic and Republican candidates, presidential job approval ratings, party, and party incumbency.
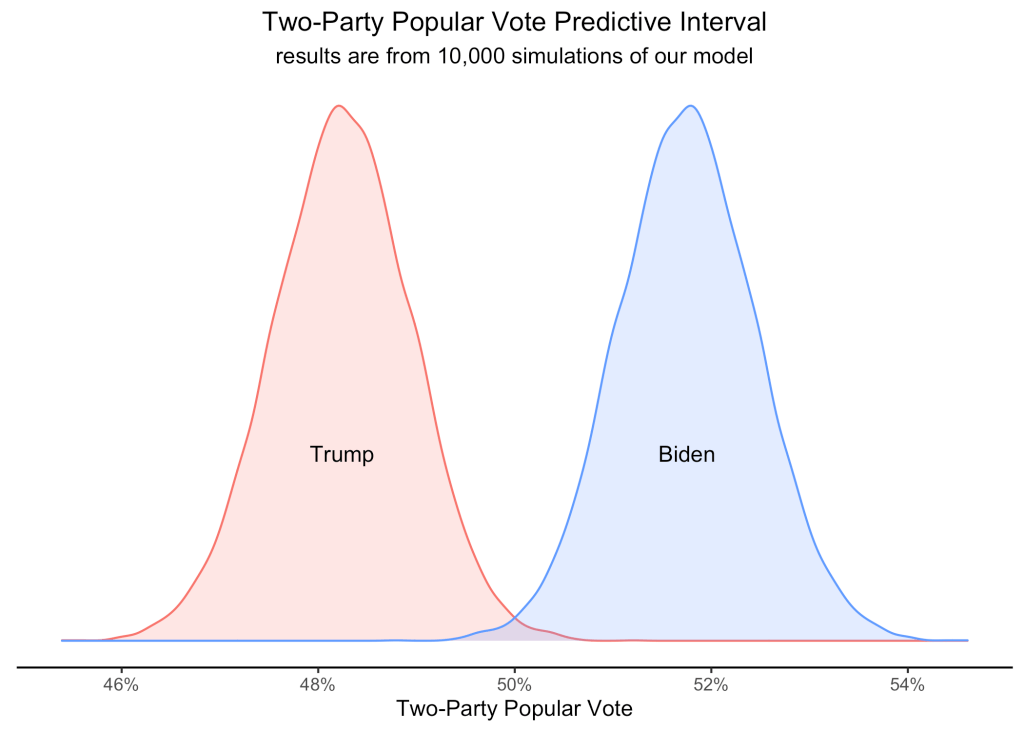
This distribution shows Trump averaging a national two-party popular vote share of 48% and Biden averaging 52% in our election simulations. We used the interval averages as our overall two-party popular vote prediction. Notably, out of the 10,000 simulated elections from this model, Trump only won a greater two-party popular vote share against Biden in 64 simulations. So, based only on this model’s predictive interval, we expect to see Biden winning the two-party popular vote.
It is important to note, however, that the United States electoral system does not depend on the popular vote, as the election is ultimately decided by the Electoral College. As you might remember, there have been two presidential elections in recent history — 2000 and 2016 — in which the elected President won the Electoral College but not the popular vote.
Nonetheless, the popular vote is still an important variable worth studying, especially since many Democrats have viewed this election as a referendum on President Trump. In the instance that President Trump is once again able to claim victory over his opponent without winning the popular vote, public opinion on replacing the electoral college with the popular vote might continue to increase.
Electoral College Prediction
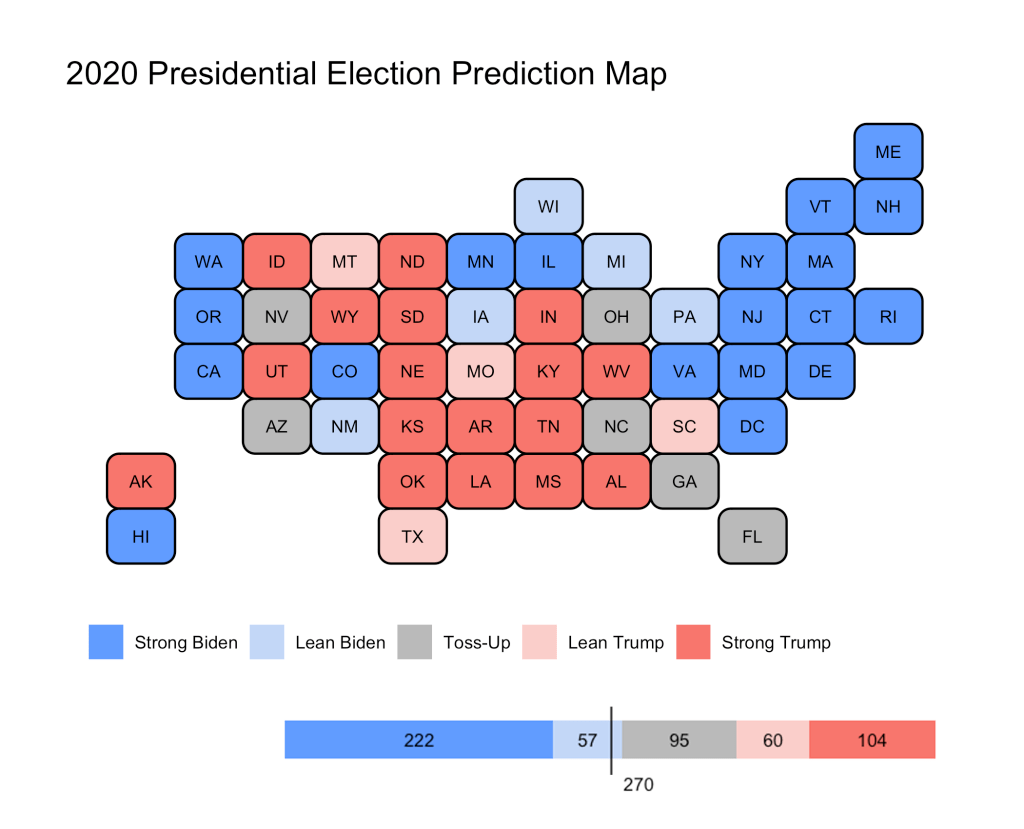
In addition to our previous model that focused on two-party popular vote, we also modeled the state-by-state electoral college outcomes through state popular vote to serve as our paramount tool in forecasting the election outcome. Our model predicts that 279 state electoral college votes are strong or lean Biden, 164 votes are strong or lean Trump, and 95 votes are a toss-up. We define strong as a model prediction giving either candidate greater than a 5% margin-of-victory, lean as between 2-5%, and toss-up as any margin within 2%. While this model does not account for the split-voting system that Maine and Nebraska use, Biden should theoretically still win enough electoral college votes to win the election at 270 votes. He just has to hold the states that are currently in favor of Biden in our model, with the closest to the toss-up border being Iowa, Pennsylvania, and Michigan. In order for Trump to win in our forecast, he’d have to win every single toss-up state and also at least one state that leans Biden, all while holding states that are in favor of him.
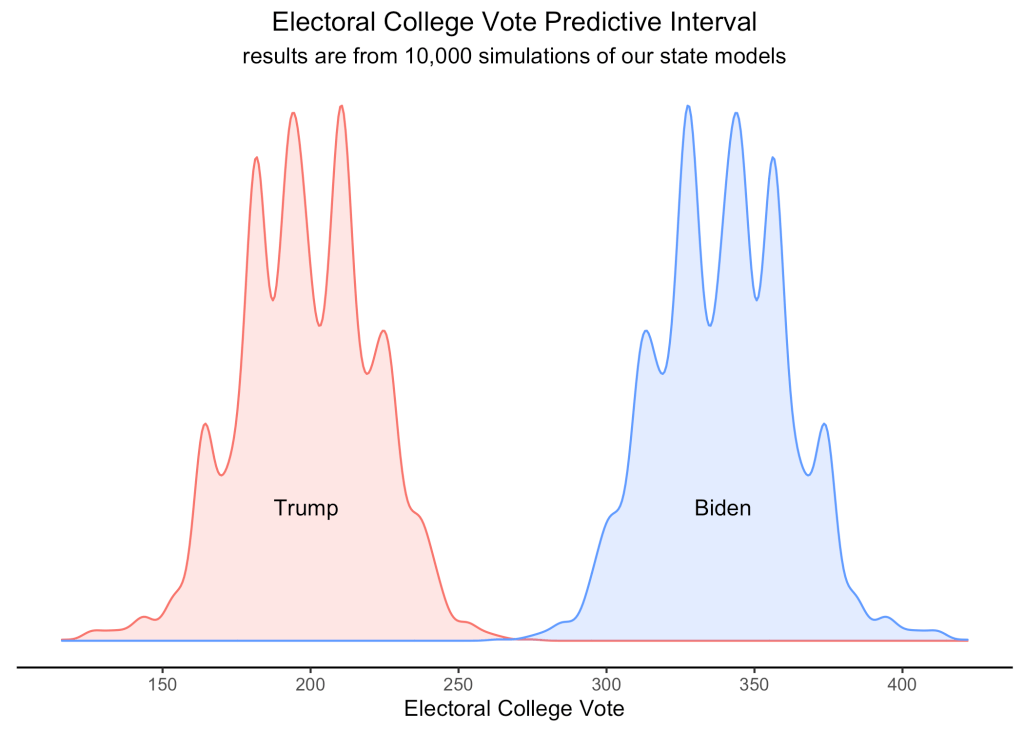
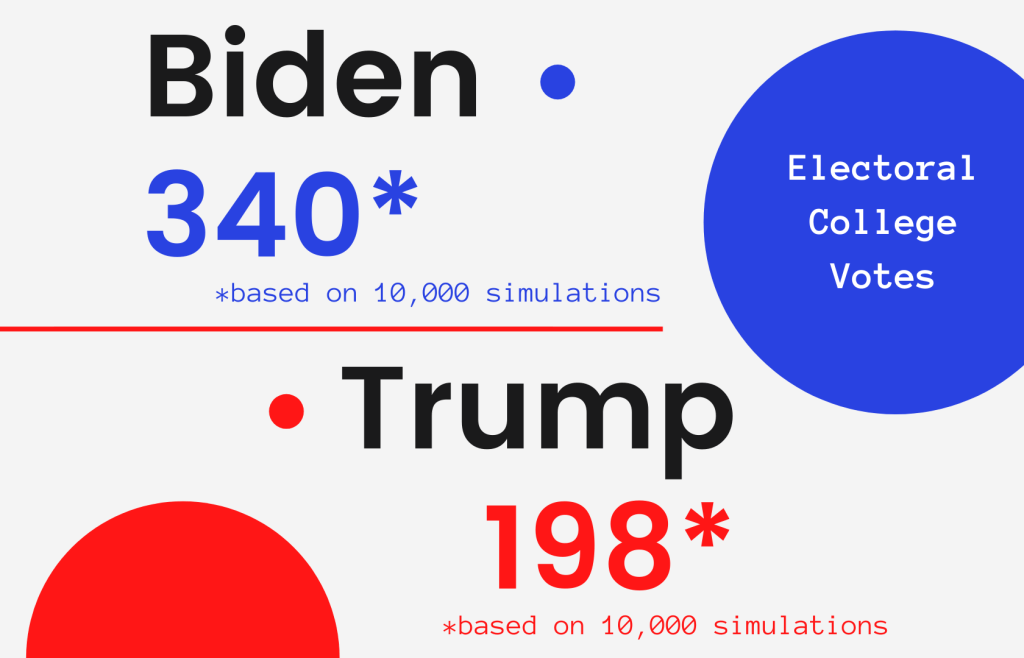
After running 10,000 election simulations for each state model, Biden averaged about 340 state electoral college votes while Trump only averaged about 198. This shows that in our simulated election results, Biden won more state electoral votes and won the simulated election most of the time. Interestingly, Trump was only able to gain more electoral college votes than Biden in 4 of the 10,000 simulations. However, we should still be cautious of this prediction, as there are many fundamental uncertainties in polling and these models. But, based only on these models, we expect to see Biden winning the electoral college.
Comparing our model results with two of the most popular forecasts this election, The Economist and FiveThirtyEight, our forecasts are not significantly different from theirs. The Economist estimates Biden to win 350 electoral college votes and Trump to win 188 electoral college votes. FiveThirtyEight estimates 347 for Biden and 191 for Trump. So, our electoral college vote prediction is just slightly more in favor of Trump at 340 for Biden and 198 for Trump. However, in our 10,000 simulations, Trump only won more electoral college votes than Biden 4 times. In simulations done by the Economist on their model, Trump won more electoral college votes 4% of the time in 20,000 simulations. For FiveThirtyEight, it was 11% from 40,000 simulations. We credit their models for being much more sophisticated and therefore being able to account for more fundamental uncertainty. However, the general trend is similar across all of our models: Biden is favored to win in 2020.
Analysis of some key states
Florida
As a key swing state with 29 electoral votes, Florida is an extremely important state in most presidential elections and 2020 is no exception. Our model predicts Florida as a toss-up between Biden and Trump with no lean towards either candidate in our model. No Republican has won the White House without winning Florida in the last 100 years and both candidates are highly aware of this. Both Trump and Biden have held many rallies in some of the state’s most contested counties. A key county to watch is Pinellas County, which was carried by Obama in 2012, flipped to vote for Trump on a 1%margin in 2016, and is now back to learning blue.
This year, Florida has already had nearly six million mail-in ballots. That’s almost two-thirds of the nine and a half million voters that voted in Florida in 2016. As of Thursday before the election, about 1.9 million mail-in ballots have still not been returned. This has led to concerns because regulations require that the ballots in Florida be returned and received by no later than 7:00 pm on Election Day, as opposed to simply being postmarked by Election Day.
Because of this, however, the results from the Florida election should arrive relatively quickly. They also allow pre-processing ballots before Election night, so a lot of ballots have been tabulated already. This means that we could likely know the results the night of the election. If the counts are close, however, it may take until Wednesday.
North Carolina
North Carolina is also a swing state in our model that leans very slightly Democrat now but did go to Donald Trump in 2016. With 15 electoral votes, it has the potential to affect the final outcome and its vote counting policies mean that we may not be able to confirm a result until very late. North Carolina allows for the counting of mail-in ballots up until Thursday, Nov. 12, 5 p.m. as long as they’re postmarked on or before Election Day. As of the Friday before the election, only approximately 60% of the requested mail-in ballots have been returned and received.
Georgia
Like North Carolina, Georgia is predicted to lean very slightly Democratic in our model despite going to Trump in 2016. Georgia’s election laws allowed for mail-in ballots to be pre-processed as early as Sept. 15, leading its Secretary of State to predict that we could see results by election night. However, he did qualify that if the results are extremely close, we would need to wait until after the statewide audit was completed to be sure, which could take until Wednesday or Thursday.
Georgia logged a record early voting turnout this year. As of Thursday before the election they are at 87% of the vote compared to 2016 and have 65% of their mail-in ballots returned and accepted.
Methodology
For our national and state models, the following variables were used as predictors:
- Average across 2020 polls after the national convention – Averaging the results of presidential polling data from FiveThirtyEight across 2020 after the national conventions (to reduce variability) should provide key insight into how people will vote in this election. To train our models, we used average historical polling data at the national level for our national model and average historical polling data at the state level for our state models (after the national convention).
- Average 2020 presidential job approval (January to July) – We expect presidential job approval to serve as a key predictor in the election, especially in the COVID-19 era, which has muddied other potential predictors, such as GDP growth, unemployment, etc. and made the public perception of them fairly hazy. The latest data we could get for 2020 was up to July, but we used the average historical presidential job approval data from January to October of previous election years to train our models. We tested that using historical averages from January to July did not affect the predictions in our models. So, we stuck with using the full data from January to October.
- Party incumbency – The party already holding office tends to have an advantage over the challenging party. To account for this historically given advantage, we included it in our model.
- Interaction between average 2020 job approval and party incumbency – While incumbency alone historically seems to serve as a strong electoral predictor, the effect that it has is influenced by other factors, including and especially job approval. Specifically, if people generally disapprove of the incumbent party, this would naturally lead to less support for their re-election. Contrarily, large approval would result in more support. In order to account for this dependence, we also incorporated an interaction term between job approval and incumbency.
- You can find our source code and data on GitHub.