Abstract
This election year, the Institute of Politics and the Harvard Political Review at Harvard College co-sponsored a survey of Harvard undergraduates to collect 2012 Election predictions. Overall, 196 students participated in the survey, sharing their predictions on outcomes in the presidential, senatorial, and house races. According to a majority of those who participated in the survey, President Barack Obama will be elected to a second term in office, the Senate will be controlled by the Democrats, and the House of Representatives will remain under strong Republican control.
Methodology
Survey participants were asked to make predictions in three categories: the Electoral College, the popular vote, and congressional races. In the first category, participants were asked to predict the outcome of 10 swing states and predict the number of electoral votes each candidate would receive. In the second category, participants were asked to predict the percentage of and number of popular votes each candidate would receive. In the third category, participants were asked to predict the outcome of 11 swing Senate races across the country as well as the change of seats in the House of Representatives.
The survey was administered via email and was limited to Harvard undergraduates only. There were 196 self-selected undergraduate participants in the survey over a five-day period, from October 29 to November 2. The survey was publicized as a contest, with one award being given in each category.
Results:
The Electoral College
Who will win the following swing states?
(% of respondents)
| Swing States | Barack Obama | Mitt Romney |
| Colorado | 64% | 36% |
| Florida | 16% | 84% |
| Iowa | 78% | 22% |
| Nevada | 83% | 17% |
| New Hampshire | 84% | 16% |
| North Carolina | 13% | 87% |
| Ohio | 84% | 16% |
| Pennsylvania | 96% | 4% |
| Wisconsin | 82% | 18% |
| Virginia | 42% | 58% |
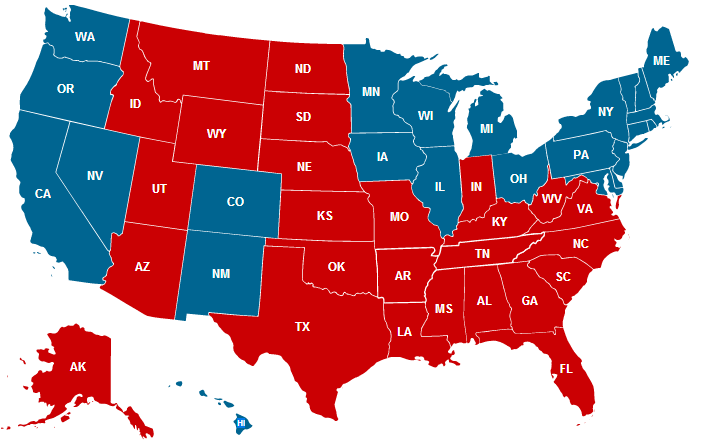
Based on the survey predictions, participants believe that the electoral map will look like the following on Election Day:
The Popular Vote
Popular Vote Projection: Obama-64,432,061 Romney-61,972,518
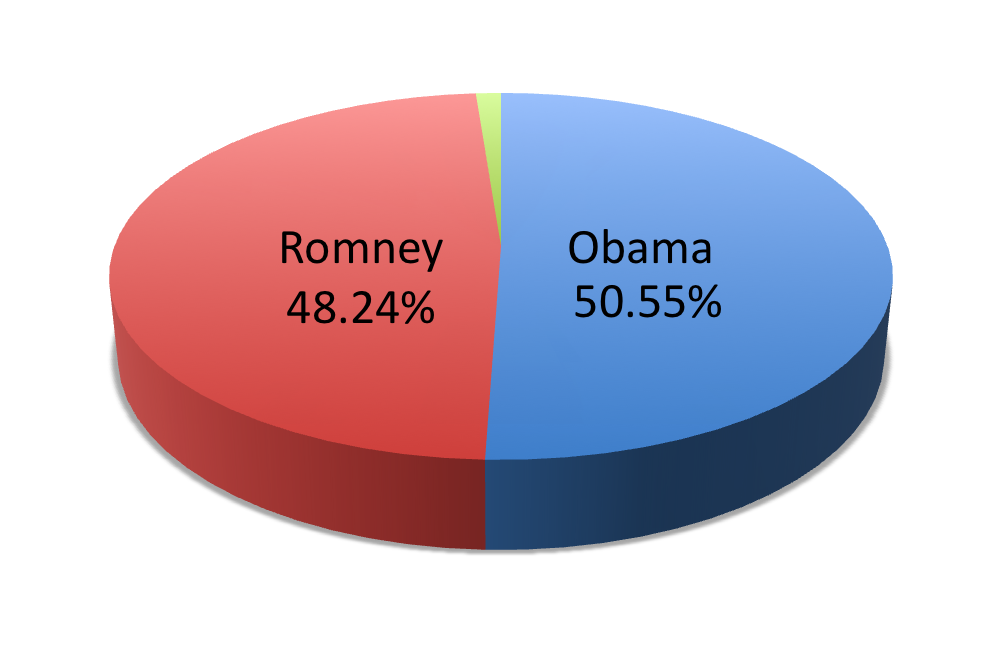
Percentage of the popular vote Projected for each candidate:
Congressional Races:
Who will win the following swing Senate races?
(% of respondents)
| Swing Senate Races | Democratic Candidate | Republican Candidate |
| Arizona (Carmona v. Flake) | 13% | 87% |
| Connecticut (Murphy v. McMahon) | 91% | 9% |
| Indiana (Donnelly v. Mourdock) | 48% | 52% |
| Massachusetts (Warren v. Brown) | 90% | 10% |
| Missouri (McCaskill v. Akin) | 78% | 22% |
| Montana (Tester v. Rehberg) | 23% | 77% |
| Nevada (Berkley v. Heller) | 25% | 75% |
| Ohio (Brown v. Mandel) | 86% | 14% |
| North Dakota (Heitkamp v. Berg) | 20% | 80% |
| Virginia (Kaine v. Allen) | 74% | 26% |
| Wisconisn (Baldwin v. Thompson) | 70% | 30% |
Average projected change in the House of Representatives: Democrats gain 4 seats
Limitations
The sample is likely to have a bias towards politically active students, which might occur for two reasons. First there is likely a self-selection bias, since politically active students are more likely to have opened and participated in the survey. Second, there is likely a bias in administration, since the survey tended to be sent out over email lists with large numbers of politically active students, as opposed to lists that would reach populations with a more diverse range of political interests.

